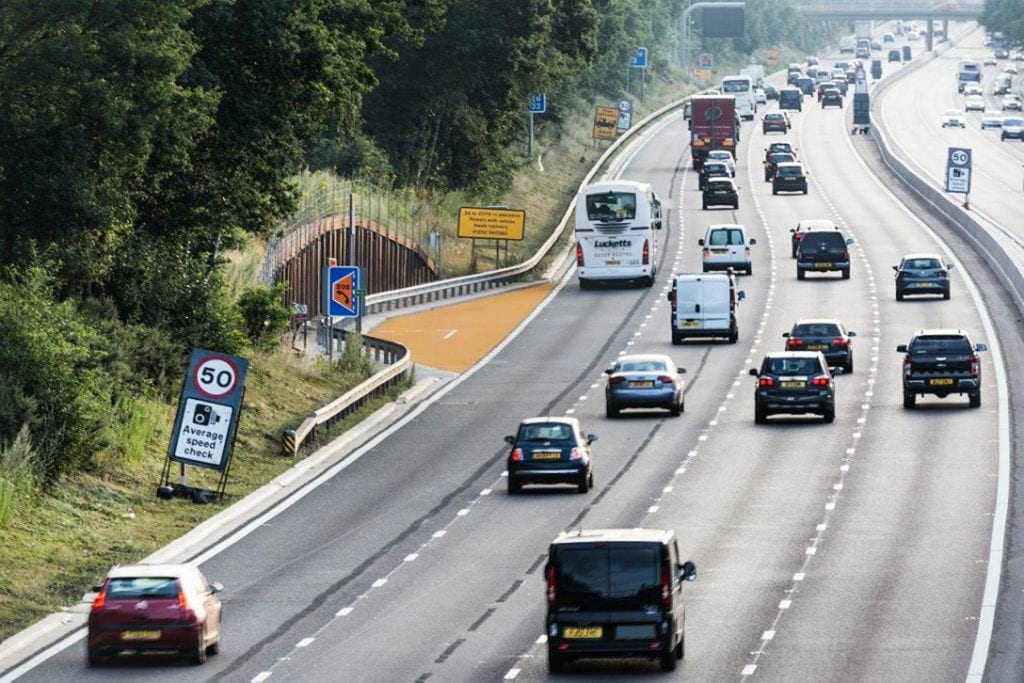
The average journey of a British driver has declined significantly from a decade ago, according to analysis of the latest MOT figures.
Anonymised data of every MOT test in the country shows that cars travelled an average of 7,134 miles in 2017, down from 7,250 in 2016 and 7,334 in 2015. In 2007, the distance travelled by each car was 7,712 miles.
With higher petrol prices, which rose from £1.05 a litre in 2015 to an average of £1.20 in 2017, before rising even further over the last two years. There is also the rise of car-share and ride-hailing services such as Uber and Waymo, with people relying on these for shorter journeys.
Despite a rise in car sales up to 2017, the average number of journeys made by car fell again last year, continuing a decline seen since 2002. The official National Travel Survey (NTS), revealed that the average person in England takes about 594 trips by car a year, compared with 678 in 2002.
The number of teenagers holding a driving licence has dropped by almost 40% in two decades, with many young people rejecting car ownership and preferring to communicate via smartphone rather than meet face to face. Business mileage has also fallen significantly as the tax regime has cut the number of company cars.
However, the RAC said that while fewer young adults are driving, it is largely because of cost pressures and university attendance, and that once they own a car their driving patterns are very similar to older drivers. But it added that cheap Uber taxi rides, and fewer visits to the high street as a result of online shopping, may be having an impact on car-usage patterns.
Carmakers are looking to adapt to the changing face of the automotive industry, by establishing, or buying into, mobility services, hoping they can continue to profit from vehicle usage in a different market. For the aftermarket, this could lead to lucrative fleet repair deals, rather than garages focusing on individual customer needs.


You must be logged in to post a comment.